Poker Companion Application Project Description
Summary
This is an application designed to provide someone playing an online poker game with additional data to help them make better decisions. It keeps track of all the actions of the opponents the user plays with and when it is the user’s turn to act it presents the user with data about how the other players at the current table have played in the past to help give the user a better idea of if their opponents are bluffing or if their opponents might fold to a bluff. There is also a testing mode where you can use screenshots taken from a previous game to simulate how the application would run if you were playing a live game. A YouTube video demonstrating the use of the app is available here.
Table of Contents
Prerequisites
Texas Hold’em
This application is based on the poker game Texas hold’em (specifically no limit Texas hold’em but it should work for limit hold’em as well) so although it is not necessary to understand Texas hold’em to use this program it won’t make much sense unless you understand it.
BetOnline
The BetOnline poker app is required to run this application in live game mode. You can test the application without the BetOnline software by using the sample screenshots available for download here.
Visual Studio
This application was written in Visual Studio 2017 and includes a SQL server database.
NuGet Packages
This application utilizes the EntityFramework v6.1.3 package and the Tesseract.Net.SDK v1.9.2 package.
Monitors
This application was developed for standard 1920 x 1080 monitors. Because of the way the program works (see the How-it-Works document for details) there will likely be issues if you try to run in on monitors with different resolutions. Additionally using the application in Screenshots Mode was designed to work with at least two monitors although it can work with one monitor and using the application in Live Game Mode was designed to work with at least three monitors although it can work with two monitors.
Hooking Up to the SQL Server Database
You will have to connect the provided database file, found in the root folder of this GitHub project, to your SQL Server and update the connection string in the app.config file to make this application work.
How to Use
This app has two primary modes. Live Game Mode should be used when you are playing a live poker game. Screenshots Mode should be used for simulating a live game with screenshots taken during a previous game. This app runs inside of two windows, the Control Window and the Data Display Window.
Control Window
This window is used to choose the mode the application will run in as well as some settings. This window also displays the player actions as they happen and has various additional features for troubleshooting and monitoring the performance of the application. Figure 1 shows the Control window before a live game is started or a screenshot is opened for processing.
Figure 1 - Control Window Without Data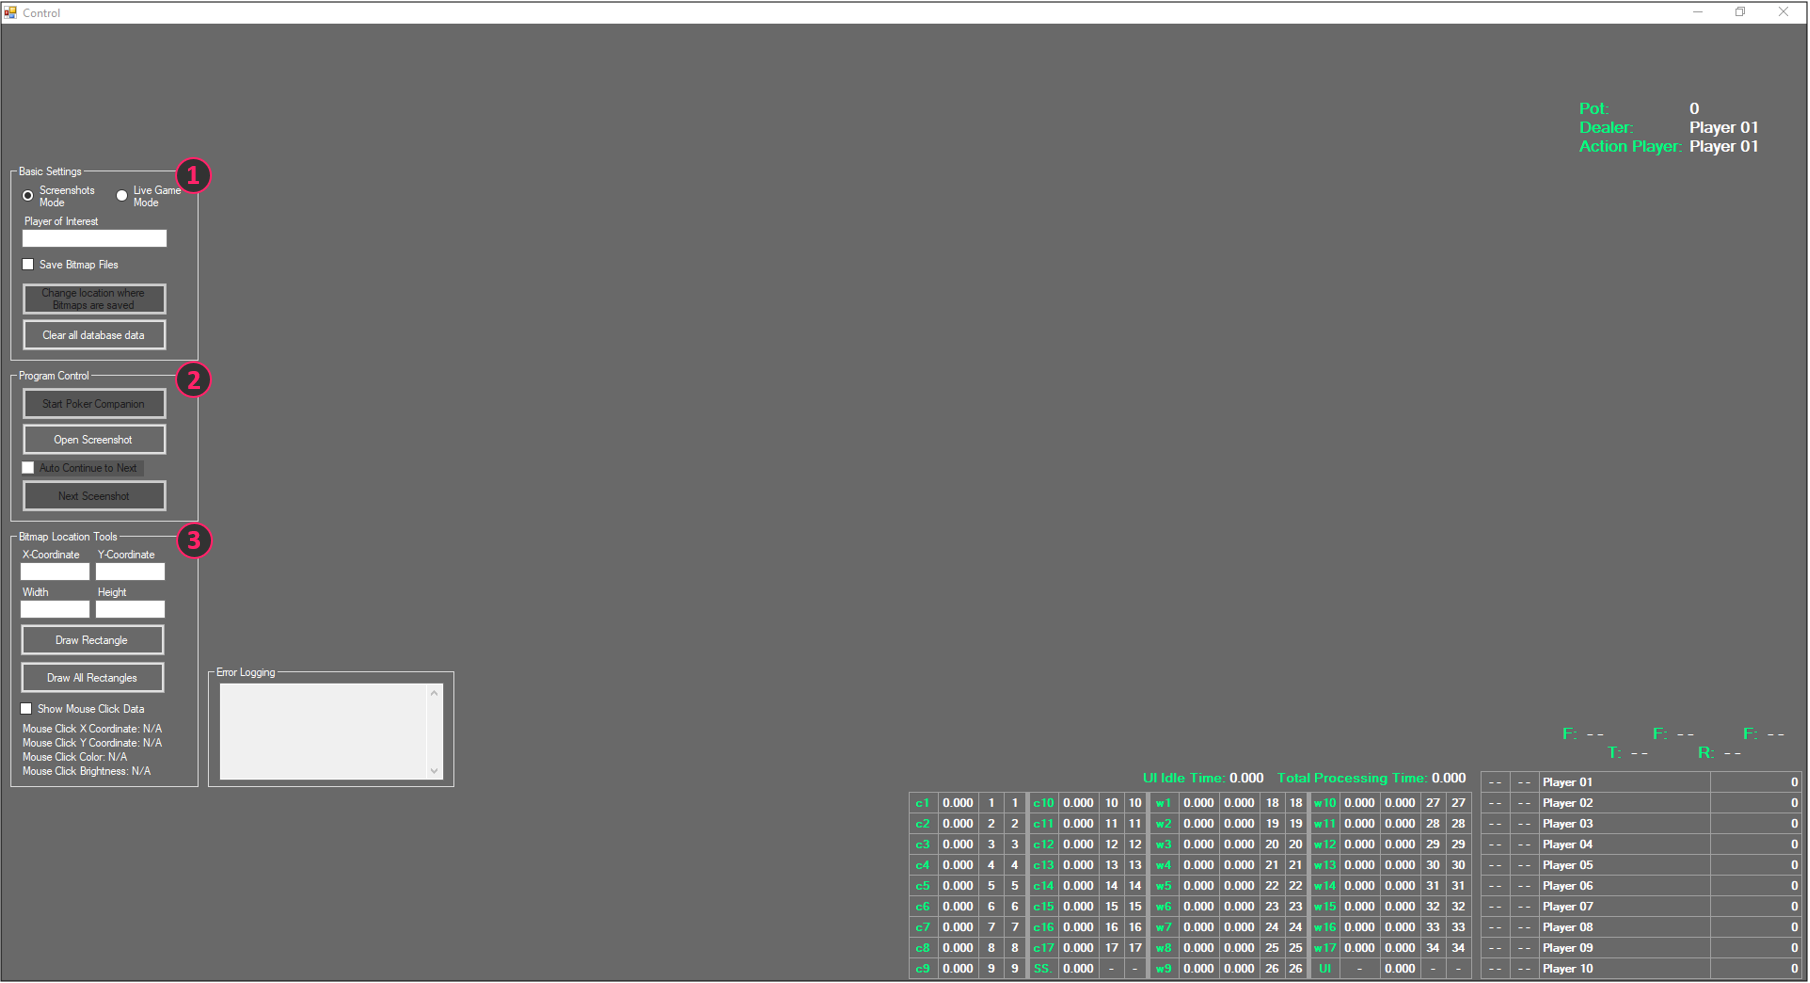
-
The “Basic Settings” groupbox contains the following controls:
a. Radio buttons for selecting either Screenshots Mode or Live Game Mode. These modes are discussed later in this document.
b. A textbox for entering the name of the player of interest which is the player you want to display the game data for. If you are playing a live game this should be your username.
c. A “Save Bitmap Files” checkbox. Check this checkbox to save the bitmap files that the app uses to process the gameplay. This can be used for troubleshooting or to get a better idea of how the app works and what it is doing. Bitmaps will be saved for every screenshot processed but the bitmaps will overwrite each other each screenshot to avoid accumulating too many files.
d. Clicking the “Change location where Bitmaps are saved” button will open up a directory explorer window where you can select where the bitmap files discussed above will be saved. By default they will be saved to your desktop. This button will only be enabled when the “Save Bitmap Files” checkbox is checked.
e. Clicking the “Clear all database data” button will clear all the data saved in the database. -
The “Program Control” groupbox contains the following controls:
a. The “Start Poker Companion” button will start taking screenshots of monitor #3 and using those screenshots to process gameplay data, save the data to the database and display data about the other players every time it is the player of interest’s turn to act. Click this button once you have a live game started. This button will only be enabled when the “Live Game Mode” radio button is selected in the “Basic Settings” groupbox.
b. The “Open Screenshot” button will open a file explorer window to allow you to navigate to a BetOnline poker table screenshot to be processed. This button will only be enabled when the “Screenshots Mode” radio button is selected in the “Basic Settings” groupbox.
c. Check the “Auto Continue to Next” checkbox and click the “Next Screenshot” button once if you wish to automatically progress through and process the screenshots in the folder where the currently selected screenshot is located. Uncheck the “Auto Continue to Next” checkbox to stop automatically progressing through screenshots. This checkbox will only be enabled when the “Screenshots Mode” radio button is selected in the “Basic Settings” groupbox and when a screenshot was previously selected using the “Open Screenshot” button.
d. The “Next Screenshot” button will progress to and process the next screenshot in the folder where the currently selected screenshot is located. This button will only be enabled when the “Screenshots Mode” radio button is selected in the “Basic Settings” groupbox and when a screenshot was previously selected using the “Open Screenshot” button. -
The “Bitmap Locations” groupbox contains the following controls:
a. The “X-Coordinate” and “Y-Coordinate” textboxes work with the “Width” and “Height” textboxes and the “Draw Rectangle” button to draw rectangles in the control window. This is useful for troubleshooting and finding the locations of certain items on the screen that you would like to process or save. Enter the X and Y coordinates of the top left corner of the rectangle you wish to draw on screen. These textboxes are only enabled when the “Screenshots Mode” radio button is selected in the “Basic Settings” groupbox.
b. The “Width” and “Height” textboxes work with the “X-Coordinate” and “Y-Coordinate” textboxes and the “Draw Rectangle” button to draw rectangles in the control window. Enter the width and height of the rectangle you wish to draw on screen in these textboxes. These textboxes are only enabled when the “Screenshots Mode” radio button is selected in the “Basic Settings” groupbox.
c. Click the “Draw Rectangle” button to draw a rectangle defined by the values in the “X-Coordinate”, “Y-Coordinate”, “Width” and “Height” textboxes described above. This button will only be enabled when the “Screenshots Mode” radio button is selected in the “Basic Settings” groupbox.
d. Click the “Draw All Rectangles” button to draw the rectangles the app uses to process the data on screen. This is useful for troubleshooting and understanding how the app works (see the How-it-Works document for details). This button will only be enabled when the “Screenshots Mode” radio button is selected in the “Basic Settings” groupbox.
e. Check the “Show Mouse Data” checkbox to start showing the mouse click data for mouse clicks inside of the Control window. The X coordinate, the Y coordinate, the color (in RGB format) and the brightness value of the pixel clicked will be displayed in the labels below the “Show Mouse Data” checkbox for every click inside the Control window while the “Show Mouse Data” checkbox is checked. This checkbox will only be enabled when the “Screenshots Mode” radio button is selected in the “Basic Settings” groupbox.
Figure 2 shows the Control window after either a screenshot or a live game image has been processed.
Figure 2 - Control Window With Data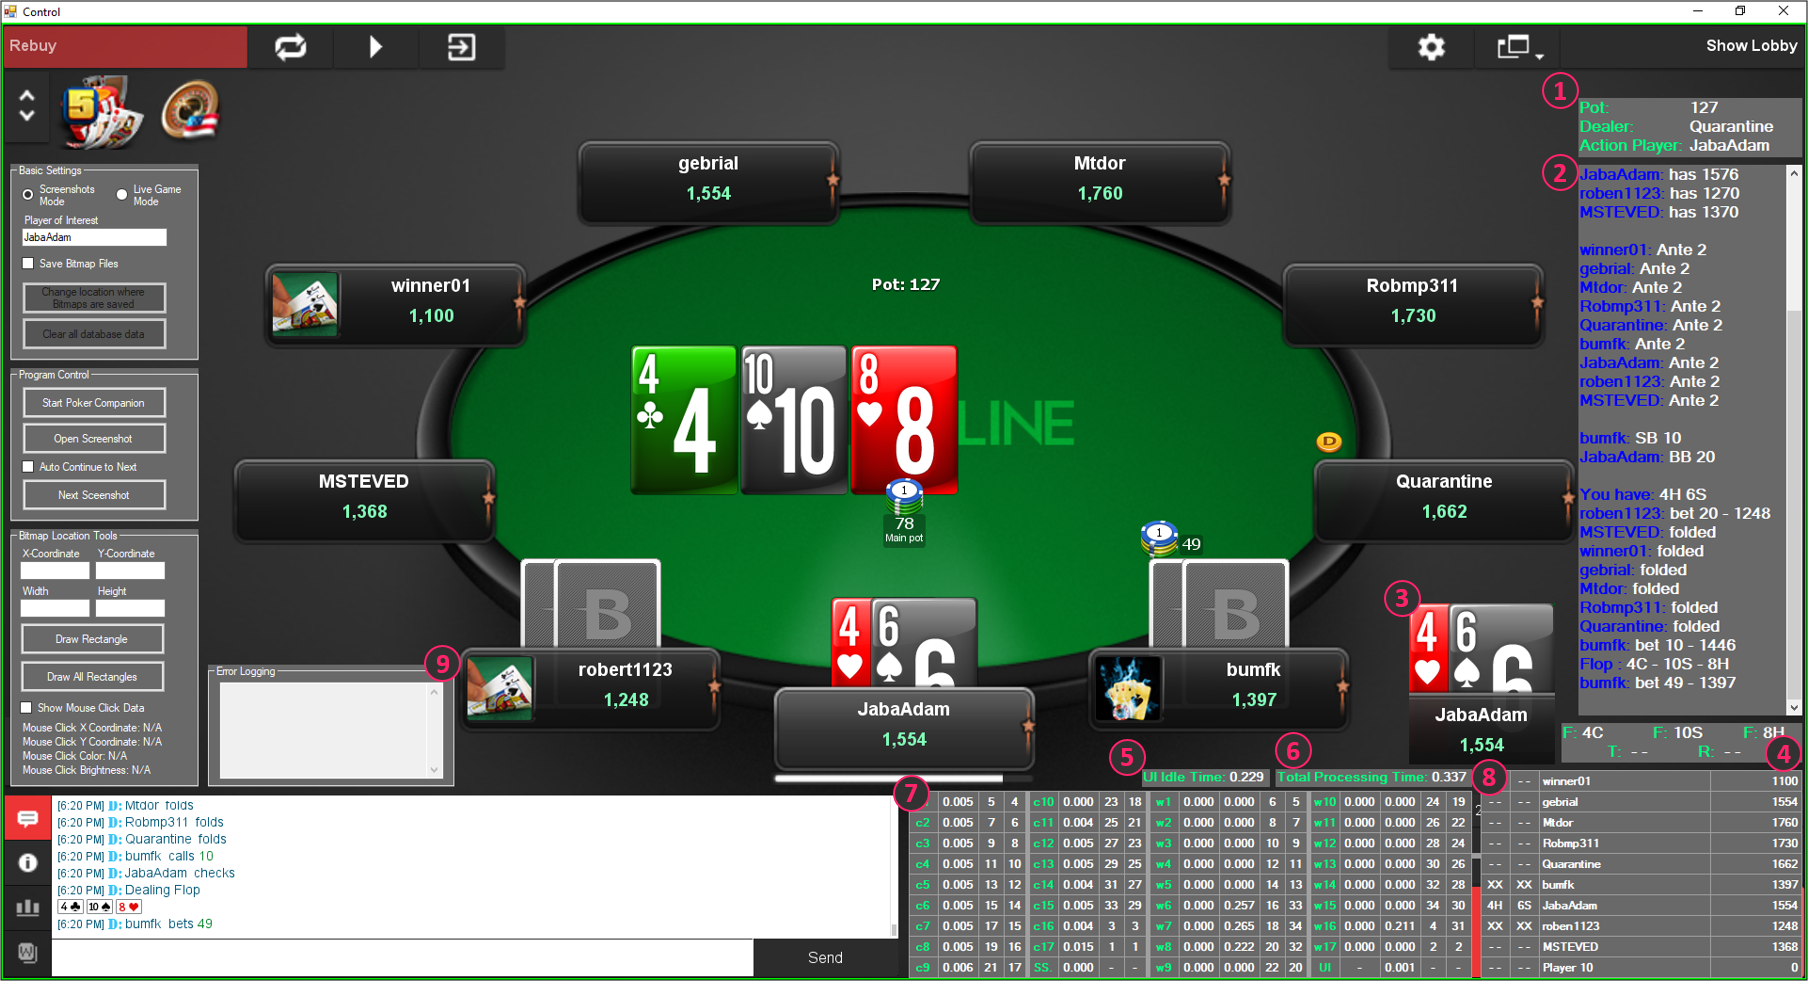
- This information area shows current pot size, the username of the dealer and the username of the action player (the player whose turn it is to act).
- This information area shows a summary of the actions that have occurred so far in the current hand. This is essentially the data that is saved to the database. It starts by stating the winner or winners of the previous hand and how many chips that player or players won. Then it shows the number of chips each player is starting the hand with. Next it shows the antes if any paid by each player. Then the big blind and small blind players and the blinds they paid. Then the actions taken by the players and the hold cards they show if any as well as the cards that come on the board. The player actions are summarized as either folds or bets, basically identifying if the player folded or made a chip transaction meaning the player’s chip count went up or down. The data about the folds, and chip transactions is translated into folds, checks, calls, bets and wins when the data is processed and displayed in the Data Display window.
- This area shows the player of interest’s hold cards. This screenshot is taken at the beginning of the hand in case the player folds but wants to know what cards they were dealt later in the hand.
- This information area shows the current state of the board. It shows the three flop cards, abbreviated as “F”, the turn card, abbreviated as “T”, and the river card abbreviated as “R”. The cards are represented by their number or symbol “J” for jack, “Q” for queen, “K” for king and “A” for ace and their suit abbreviated as “C” for clubs, “D” for diamonds, “H” for hearts and “S” for spades.
- This label shows how long in seconds the UI thread was left idol while data for the current screenshot was being processed. This is for troubleshooting and application optimization purposes.
- This label shows the total time it took in seconds for the current screenshot to be processed. This is for troubleshooting and application optimization purposes.
- This table shows information about the processing of the data and is for troubleshooting and or optimization purposes only. The values with the letter “c” followed by a number represent information about the process of copying smaller bitmap images from the larger screenshot of the poker table for later use. The number to the right of that element is the time it took to copy that bitmap image in seconds, the number to the right of that represents the order in which that process was started and the number to the right of that represents the order in which that process was completed. The values with the letter “w” followed by a number represent information about the processing of the bitmap images that were copied. The number to the right of that element is the time it took to create the worker thread to process that data in seconds. The number to the right of that element is the time it took to process the data in the corresponding bitmap image in seconds. The number to the right of that represents the order in which that process was started and the number to the right of that represents the order in which that process was completed. The “UI” box represents information about the updating of the UI by the UI thread after all the screenshot data was processed. The value two cells to the right of the “UI” box represents how long it took to update the UI in seconds. The “SS.” box currently does not represent anything and it’s corresponding time is always 0. See the How-it-Works document for details about the screenshot copies, the worker threads and the sequence of processes.
- This table shows the current data about the players at the table. To the left of the player’s username are two columns for the player’s two hold cards. “- -“ represents no card and “XX” represent a face down card. To the right of the player’s user name is that player’s chip count.
- This is a textbox for error logging. Logical or runtime errors can be logged and output here.
Data Display Window
This window displays relevant data about previous player actions to aid in making decisions during a poker game. Figure 3 shows the Data Display window before data is processed and displayed to the user.
Figure 3 - Data Display Window Without Data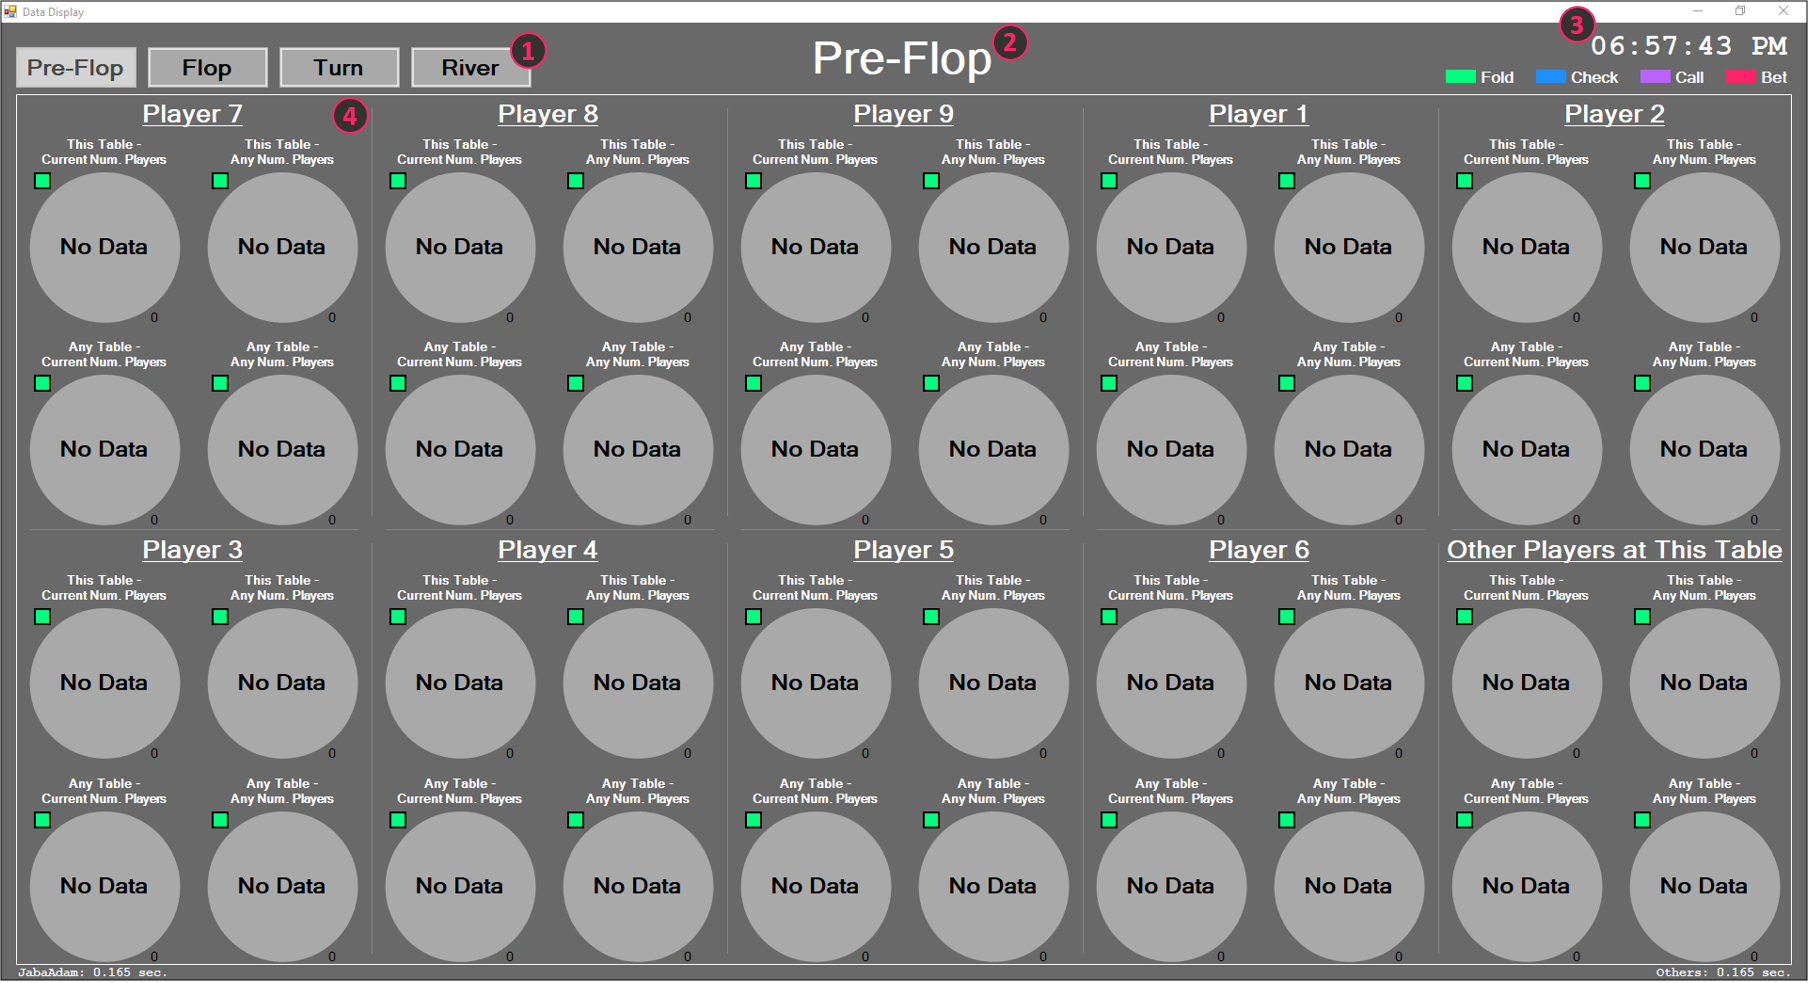
- These buttons let you select the action round you wish to see data for, either pre-flop, flop, turn or river.
- This labels shows which action round you are currently seeing the data for.
- This labels shows the last time this data was updated.
- Each one of these ten sections shows the data for one player or group of players.
Figure 4 shows what the Data Display window looks like after data has been processed and displayed. The Data Display window processes and updates data when it is the player of interest’s turn to act in either Screenshots Mode or Live Game Mode.
Figure 4 - Data Display Window With Data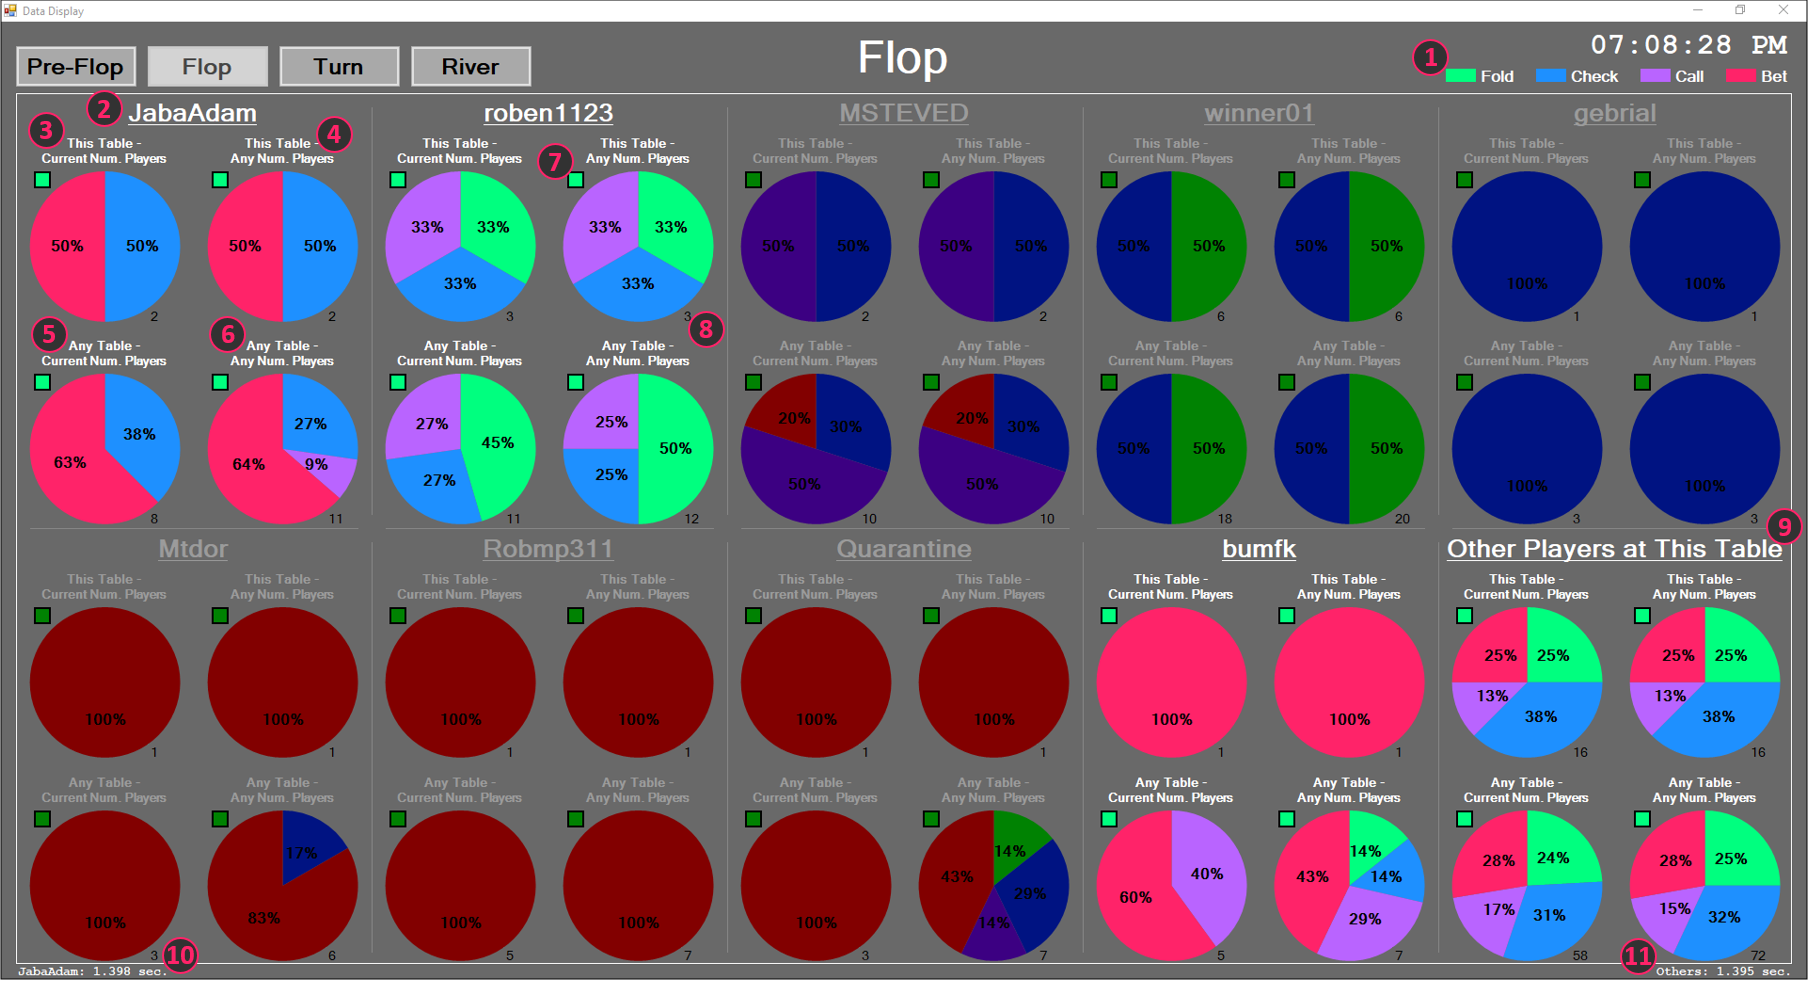
- This is the legend for interpreting the color code used on the pie graphs. Folds are represented by green, checks are represented by blue, calls are represented by purple and bets are represented by red. Note that darkened versions of these colors are used to display the data for players that have already folded in the current hand indicating their data is not as relevant to the decision the player of interest is currently being presented with.
- The name of the player or group of players whose data is being displayed in this section.
- This pie chart represents the fold, check, call and bet actions the corresponding player has taken as a percentage of the total number of player action data points available. This pie chart represents the data for this player at this table with the number of players currently playing at the table.
- This pie chart represents the fold, check, call and bet actions the corresponding player has taken as a percentage of the total number of player action data points available. This pie chart represents the data for this player at this table with any number of players playing at the table.
- This pie chart represents the fold, check, call and bet actions the corresponding player has taken as a percentage of the total number of player action data points available. This pie chart represents the data for this player at any table (applicable if you have played against this player in more than one game) with the number of players currently playing at the table.
- This pie chart represents the fold, check, call and bet actions the corresponding player has taken as a percentage of the total number of player action data points available. This pie chart represents the data for this player at any table (applicable if you have played against this player in more than one game) with any number of players playing at the table.
- This box indicates if it’s corresponding pie chart is currently updated. The box will be green if the data is updated and red if it is not.
- The number below and to the right of each pie chart represents the number of data points that the corresponding pie chart contains.
- This section contains the aggregate data for all the players at the table excluding the player of interest.
- This number is the time it took to query and process the data for all of of the players at the table including the player of interest in seconds. This data for troubleshooting and or optimization purposes only.
- This number is the time it took to query and process the data for all of of the players at the table excluding the player of interest in seconds. This data is for troubleshooting and optimization purposes only.
Screenshots Mode
This mode allows you to run the application based on screenshots taken during a previously played game of Texas hold’em played on the BetOnline poker app. It processes data, saves that data to the database and displays relevant data when it is the player of interest’s turn to act (the player of interest is the player you are simulating playing as). This is useful for testing the app and/or seeing how it works. A set of sample screenshots is available for download here. As you move through consecutive screenshots you will see the screenshot displayed in the Control window as well as the game status and the actions taking place. The game status and game actions are also saved to the database.
A YouTube video demonstrating the app running in screenshots mode is available here.
Screenshots mode is designed to be run with the Control window on one monitor and the Data Display window on a second monitor as shown in Figure 5. The screenshots that are being processed are displayed in the Control window as shown in Figure 5. The relevant data about previous player actions is displayed in the Data Display window when it is the player of interest’s turn to act.
Figure 5 - Screenshots Mode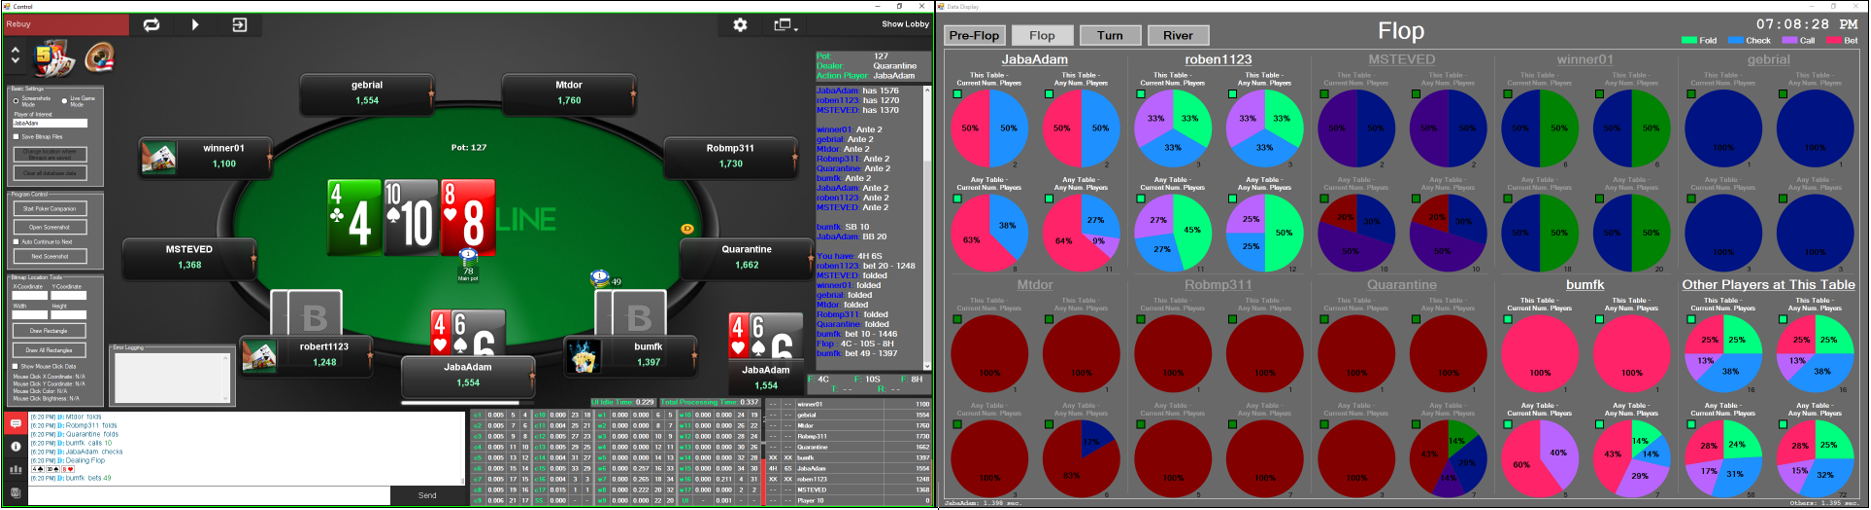
To begin running the application in screenshots mode select the “Screenshots Mode” radio button in the Basic Settings groupbox. Enter the player of interest’s username in the “Player of Interest” textbox. The default value is “JabaAdam” which will work with the sample screenshots available for download here. Click the “Open Screenshot” button in the Program Control groupbox and navigate to the the location of the screenshot you wish to process and select it. This will display the screenshot in the Control window and process the data. If more consecutive screenshots are available in the folder you selected you can click the “Next Screenshot” button to progress to the next screenshot in the folder. Check the “Auto Continue to Next” checkbox before clicking the “Next Screenshot” button to automatically move through the screenshots in the folder.
Live Game Mode
This mode processes data, saves it to the database and displays relevant data as you are playing a game of Texas hold’em on the BetOnline poker app. Note that this app only works on 9 player tables and the BetOnline app window must be maximized (see the How-it-Works document for details).
Enter your username in the “Player of Interest” textbox so that relevant data about the other players will be displayed in the Data Display window every time it is your turn to act. This mode runs the application for it’s intended purpose which is to provide useful data about the past actions of the players at a table while a game is being played in order to help the application’s user make better decisions based on the other player’s past behaviors.
Live Game mode was designed to be run with the Control window on one monitor, the Data Display window on second monitor and the actual BetOnline poker game being played on a third monitor as shown in Figure 6. Screenshots of the live game being played are automatically captured, displayed in the Control window and processed as shown in Figure 6. The relevant data about previous player actions is displayed in the Data Display window when it is the player of interest’s turn to act as shown in Figure 6.
Figure 6 - Live Game Mode
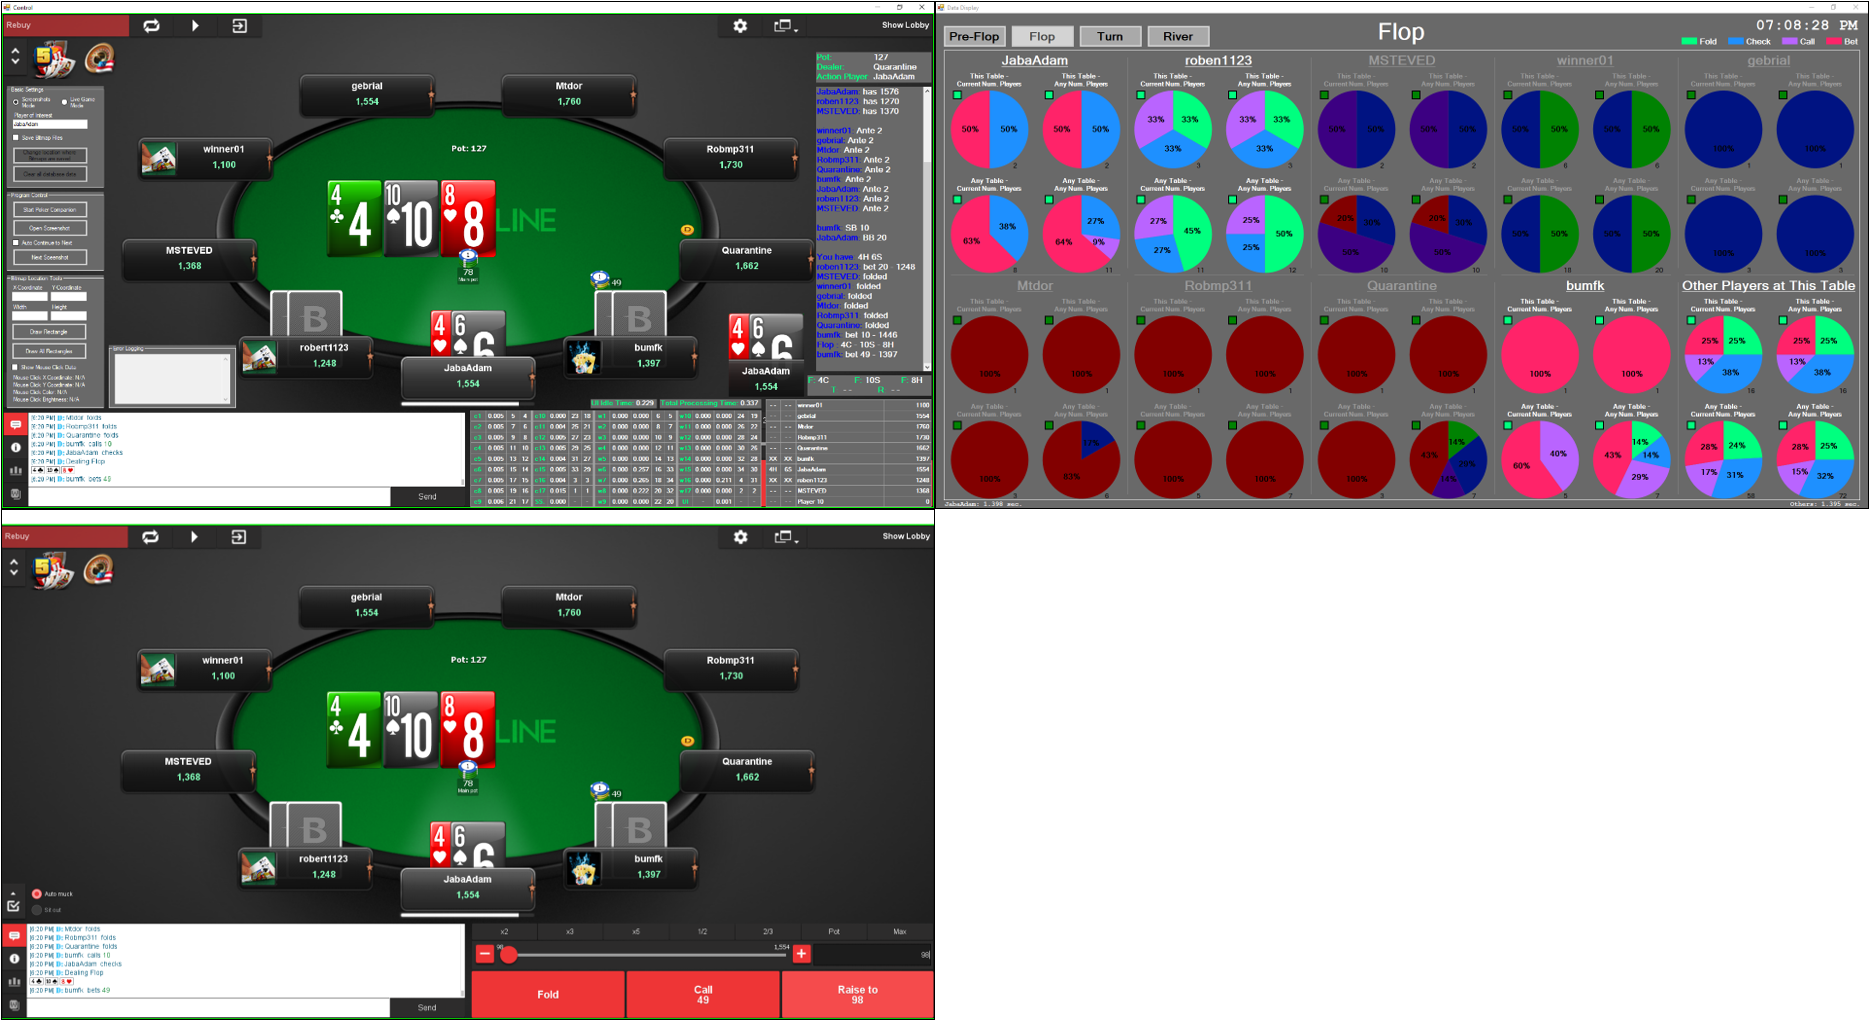
To begin running the application in Live Game mode select the “Live Game Mode” radio button in the Basic Settings groupbox. Enter the player of interest’s username in the “Player of Interest” textbox. Click the “Start Poker Companion” button in the Program Control groupbox. Note that your live BetOnline poker game should be maximized on the monitor with index 0. If the BetOnline poker game is being played on the wrong monitor you will see the image of the monitor it should be on displayed in the control window.
How it Works
For more information about how the application works see the How-it-Works document.